
Using Offensive Starting Field Position to Evaluate Punter Performance
Introducing Field Position Over Expected (FPOE)

Football analytics has come a long way in the past decade in terms of being able to evaluate on field performance for the offensive and defensive sides of the ball, but I’ve felt like special teams has lagged behind a bit.
I feel like this is especially true in regard to punter evaluation.
Using data available through the nflreadr package in R, I’ve created a metric to evaluate how punters performed based on the starting field position of the offense following a punt and where the punt took place from. I’m calling it Field Position Over Expected (FPOE).
Methodology
The thought process behind using the starting field position of the offense while also considering the yard line where the punt took place from came from me not feeling like the typical punt average was descriptive enough as far as a punter’s ability.
For example, if a punter is kicking from his opponent’s 40 yard line and the punt is downed at the 1 yard line, that is a great punt and he achieved the best possible outcome, however this only nets him 39 yards and would bring his average down if he is averaging more than that on the season. This is where FPOE comes in.
FPOE considers where the punt took place from and is the difference between the expected starting field position of the offense following a punt and the actual starting field position of the offense. Expressed in yards, a positive number indicates that the offense started farther away from the end zone than expected, and a negative number means the offense started closer than expected.
The main issue I ran into with this stat is long returns. Obviously punters are somewhat responsible for how a return goes, but I didn’t want to assign them all of the blame. I opted to cut off their share at 7 return yards; any more than that is assigned to the coverage team.
Model
I used a multivariable linear regression model with the features being the distance from the opponents endzone (yardline_100), the score differential (score_differential), the quarter (qtr), and the seconds remaining in the quarter (quarter_seconds_remaining) to calculate the expected starting yard line of the offense.
Results
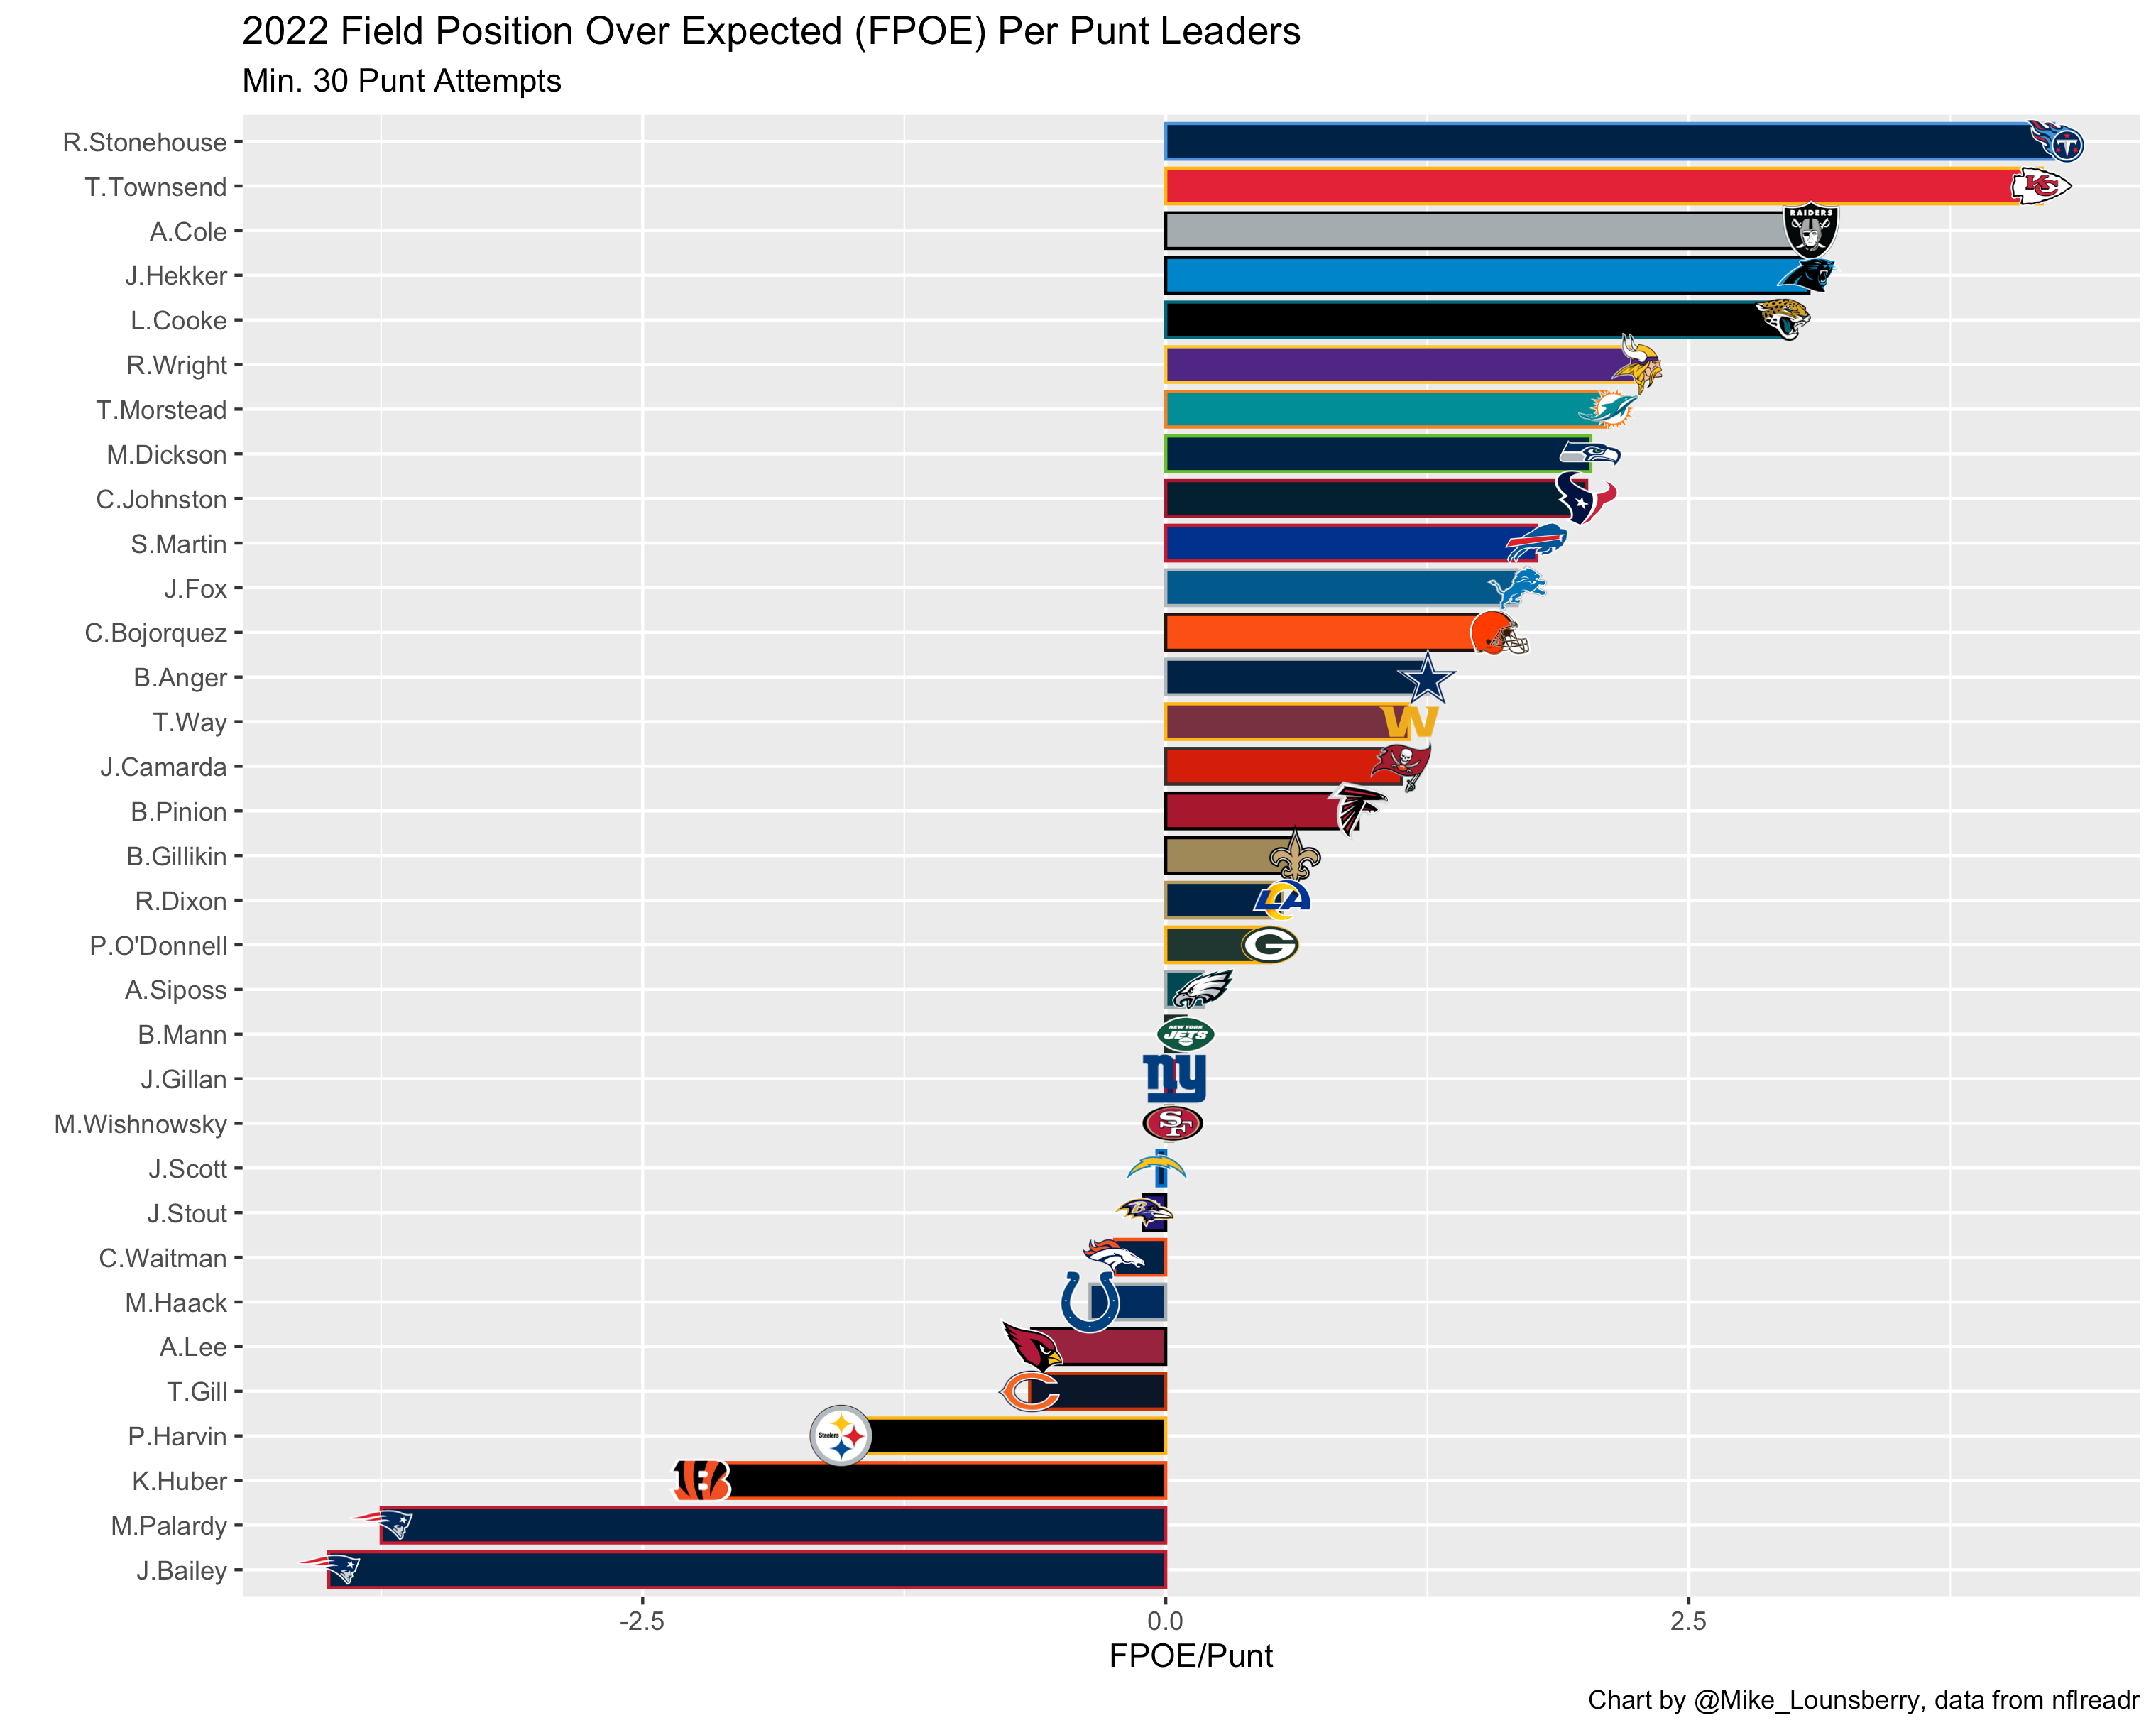
Since 2015, the leader in either FPOE/Punt or Total FPOE has been voted the 1st Team All-Pro punter in 6 of the last 8 seasons, with 2018 and 2022 being the only exceptions (The FPOE/Punt leader in 2018, Johnny Hekker, was 2nd Team All-Pro).
Here are the FPOE/Punt rankings for the 2022 NFL regular season, where 2nd Team All-Pro Ryan Stonehouse just edged out 1st Team All-Pro Tommy Townsend:
If you’re curious what the other seasons look like, I’ve created a shiny app where you can look at the rankings from each season since 2015 here: FPOE Rankings
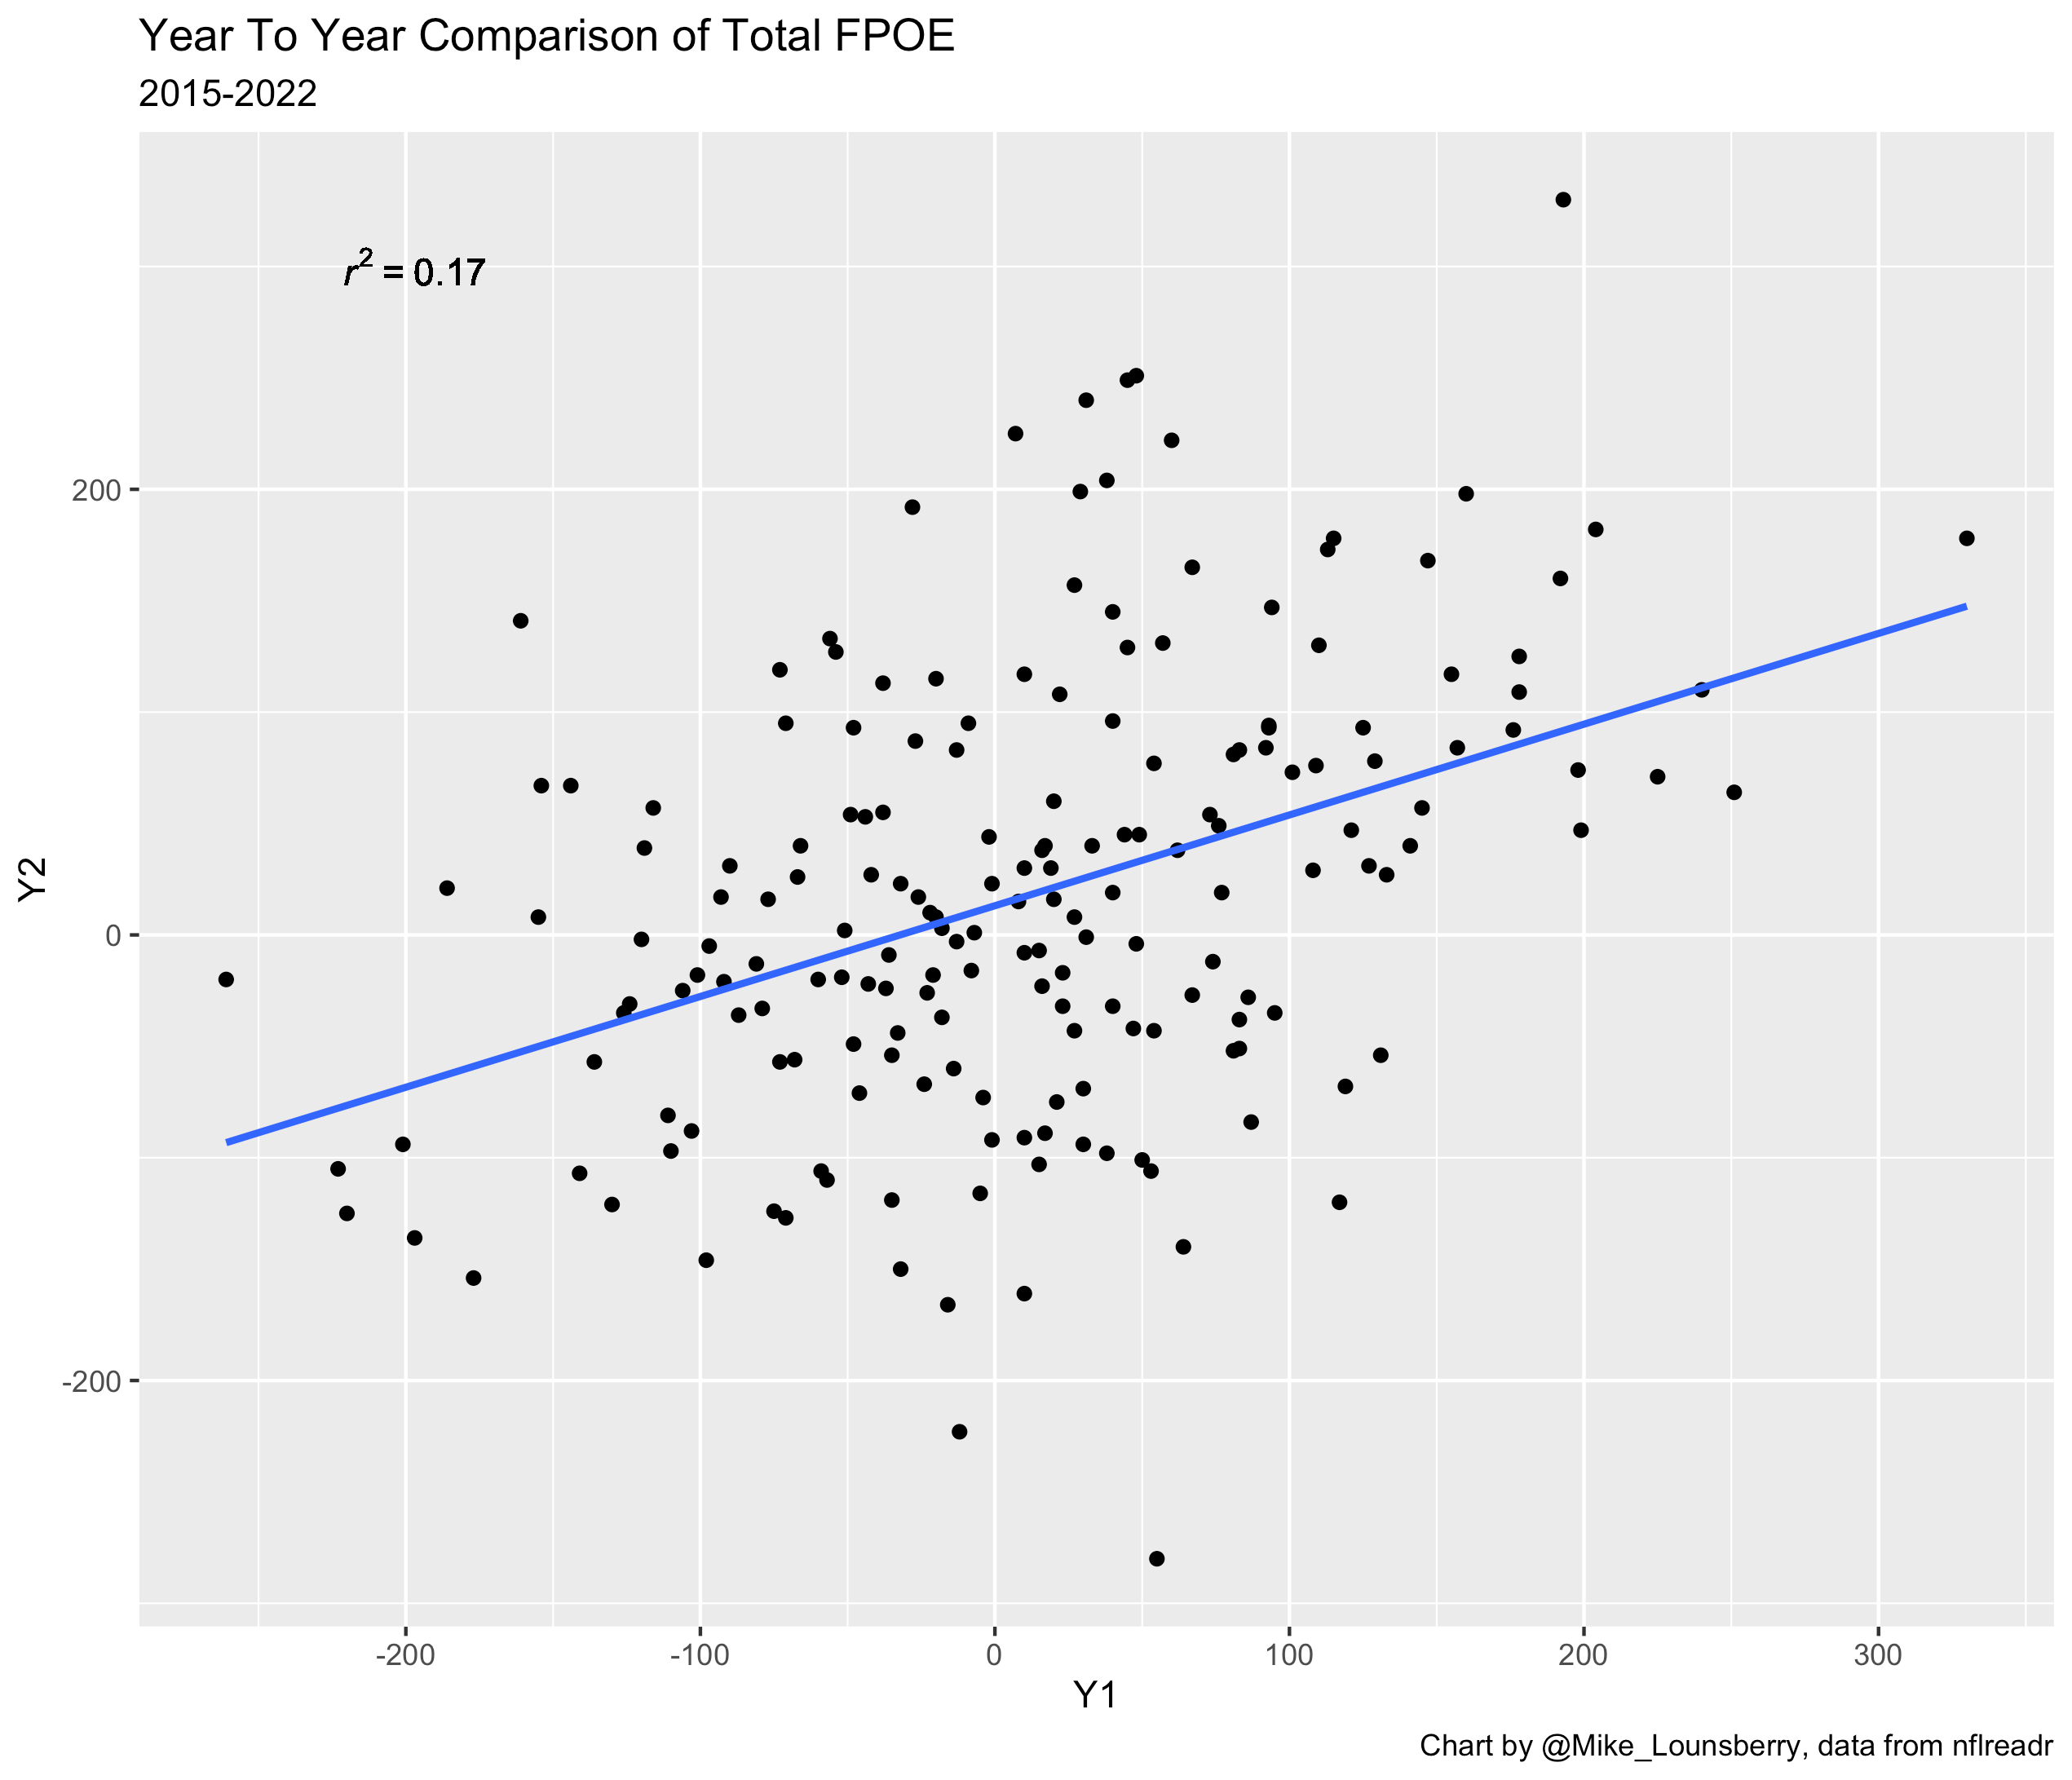
As far as year-to-year consistency, FPOE metrics perform better than the more common punting stats such as Net Punt Average (r² = 0.13) and Net Yards (r² = 0.09), as the year-to-year r² of FPOE/Punt is 0.14, while Total FPOE has a r² of 0.17.
Conclusion
While no stat can be the end-all-be-all for measuring player performance, I think FPOE can be an additional tool to help evaluate punter performance at a deeper level than some of the more common punting stats available today.
The code for this project can be found on my github here: Github
Where to Find Me
Twitter: @Mike_Lounsberry
LinkedIn: Mike Lounsberry
Email: lounsberrym@gmail.com